Sebec Lake Water Clarity & Quality
SLA has volunteers who spend their time taking samples and readings relative to lake water quality and clairity.
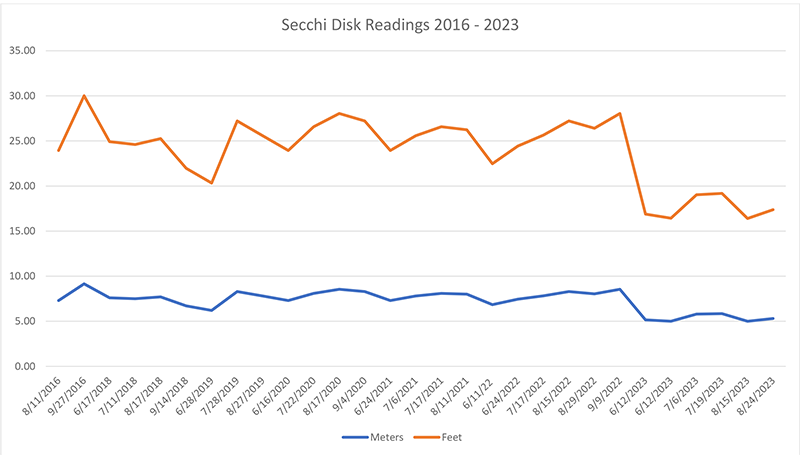
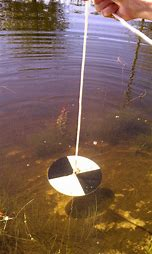
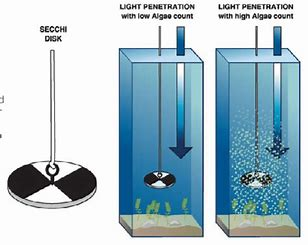
Water clarity is measured using a Secchi Disk. The Secchi disk (or Secchi disc) dates back to 1865. It is a plain white, circular disk 30 cm (12 in) in diameter used to measure water transparency or turbidity in bodies of water. The disc is attached to a line and lowered slowly down into the water. The depth at which the disk is no longer visible is taken as a measure of the transparency of the water. This measure is known as the Secchi depth and is related to water turbidity. Many elements can affect this measurement, including rainfall, watershed runoff, pollen, algae in and turbidity of the lake. For example, summer 2023 was influenced by frequent, and sometimes very heavy rainfall, a heavy pollen season and a greater number of year-round homes on the lake that are landscaped nearly to the shore (fertilizer runoff).
On Sebec, clarity is measured at the same two locations on both the upper - large and lower - smaller water bodies. Measurements are taken at about the same time each day as the sun's angle can influence the ability to "see" the disk in the water. Generally, readings are taken in the summer months, May through September.


2023-08-24: 5.30
2023-08-15: 5.00
2023-07-19: 5.85
2023-07-06: 5.80
2023-06-22: 5.01
2023-06-12: 5.15
2022-09-09: 8.55
2022-08-29: 8.05
2022-08-15: 8.30
2022-07-17: 7.82
2022-06-24: 7.45
2022-06-11: 6.85
2021-08-11: 8.00
2021-07-17: 8.10
2021-07-06: 7.80
2021-06-24: 7.30
2020-09-04: 8.30
2020-08-17: 8.55
2020-07-22: 8.10
2020-06-16: 7.30
2019-08-27: 7.80
2019-07-28: 8.30
2019-06-28: 6.20
2018-09-14: 6.70
2018-08-17: 7.70
2018-07-11: 7.50
2018-06-17: 7.60
2017-08-29: 6.70
2017-07-26: 8.10
2017-06-27: 5.15
2016-09-27: 9.15
2016-08-11: 7.30
2014-09-17: 7.55
2014-09-08: 7.62
2014-08-26: 6.91
2014-07-30: 6.21
2013-09-17: 7.16
2013-09-01: 6.01
2013-08-28: 7.31
2013-08-20: 6.40
2013-07-31: 7.46
2012-09-17: 6.81
2012-09-01: 6.96
2012-08-14: 6.35
2012-07-24: 6.31
2011-09-18: 6.82
2011-09-02: 7.66
2011-08-18: 8.21
2011-07-15: 8.96
2010-09-18: 8.82
2010-09-03: 8.50
2010-08-13: 7.73
2010-08-01: 6.83
2010-07-15: 8.69
2010-06-27: 7.06
2009-09-10: 7.28
2009-09-04: 6.70
2009-08-25: 5.85
2009-08-10: 6.21
2009-07-20: 5.59
2008-09-24: 7.31
2008-09-17: 8.48
2008-08-22: 7.00
2008-08-04: 5.30
2008-07-16: 8.11
2007-10-05: 9.49
2007-09-20: 9.09
2007-09-07: 8.06
2007-08-21: 9.11
2007-08-14: 8.30
2007-08-07: 9.43
2007-07-14: 8.25
2006-09-11: 6.55
2006-08-14: 7.30
2006-08-02: 6.85
2006-07-16: 6.93
2006-07-08: 7.00
2005-10-02: 6.43
2005-09-22: 5.90
2005-09-02: 5.37
2005-08-17: 6.13
2005-08-09: 6.58
2005-07-17: 5.63
2005-07-08: 4.99
2005-06-26: 4.68
2004-09-30: 7.96
2004-09-15: 7.45
2004-08-29: 5.84
2004-08-18: 5.83
2004-07-18: 8.72
2004-06-29: 7.56
2004-06-17: 8.43
2003-09-18: 9.23
2003-09-01: 7.97
2003-08-15: 7.90
2003-08-03: 7.21
2003-07-13: 7.54
2003-06-26: 7.43
2003-05-26: 7.80
2002-09-25: 8.30
2002-09-09: 7.80
2002-08-28: 8.30
2002-08-13: 7.80
2002-07-31: 8.50
2002-07-13: 8.10
2002-06-27: 7.90
2002-06-19: 8.05
2001-10-05: 7.80
2001-09-14: 7.90
2001-09-04: 7.50
2001-08-26: 7.85
2001-08-20: 7.65
2001-07-29: 7.86
2001-07-04: 8.25
2000-08-22: 8.00
2000-08-01: 8.80
1999-09-05: 7.80
1999-08-25: 7.90
1999-07-04: 6.50
1998-09-20: 6.00
1998-09-07: 6.15
1998-08-14: 5.50
1998-08-01: 5.90
1998-07-18: 6.20
1998-07-01: 5.65
1997-09-13: 8.60
1997-08-24: 8.00
1997-08-08: 8.40
1997-07-24: 7.80
1997-07-11: 5.90
1997-06-28: 5.40
1997-06-10: 4.50


